Red America / Blue America : By the Numbers
For the past 5 years, American Politics has quickly shot up in the ratings, becoming the most popular show on television in decades. In earlier, more gentle centuries, Baseball was considered America's unofficial pastime, but now solidifying your world-view with your cable news channel of choice and casually hating your neighbor has quickly become America's most beloved hobby. And who can blame us? The characters. The scandals. The highest stakes in the land! It is high drama playing out before our eyes, with the added bonus of masquerading as slightly educational.
But let's get past all the pageantry for a moment, shall we, because it's easy to forget that the best show on television actually has the secondary purpose of providing the protection and well-being to the 327 million citizens of America. So whatever scandal just broke last night, or whatever nonsense showed up on your Facebook feed this morning, let's go right past that and dig into some dry, numerical statistics of our two least favorite fictional countries; The United States of Red America and The United States of Blue America. What if they were actual countries? What kind of GDP's would they have? How safe would it be to live there? Will my marriage last in The United States of Blue America? Let's find out.
So what's a Red State and a Blue State?
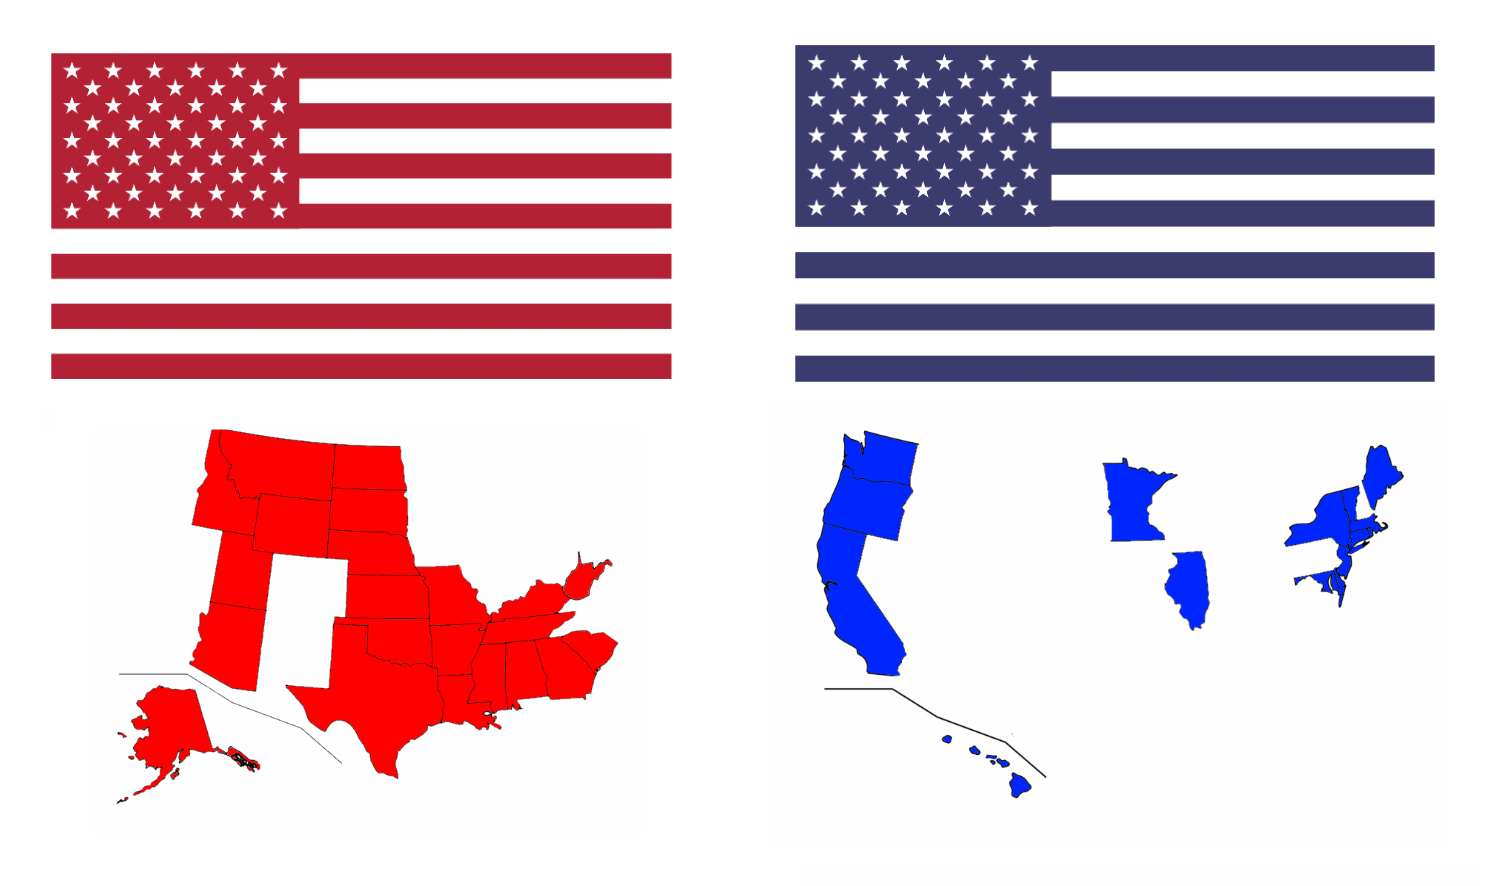
Well, it's those, right up there, but I should explain how I got there because this might be the most contentious aspect of the whole article. While it's true that no state is completely controlled by either party, and almost every square inch of America is some shade of purple, most people define Red States and Blue States by their voting patterns in Presidential elections, which for many states is surprisingly consistent. Since the year 2000, 37 States have voted for the same political party in all 5 US Presidential elections. If you would like to argue with this methodology, you can find the comment section below.
Also, for the purposes of this statistical thought experiment, the 13 purple states left over will be considered lakes, or abysmal voids or whatever. They don't matter. The breakdown shakes out as follows:
Red States: Alabama, Alaska, Arizona, Arkansas, Georgia, Idaho, Kansas, Kentucky, Louisiana, Mississippi, Missouri, Montana, Nebraska, North Dakota, Oklahoma, South Carolina, South Dakota, Tennessee, Texas, Utah, West Virginia, and Wyoming.
Blue States: California, Connecticut, Delaware, Hawaii, Illinois, Maine, Maryland, Massachusetts, Minnesota, New Jersey, New York, Oregon, Rhode Island, Vermont, and Washington.
Abysmal Voids: Colorado, Florida, Indiana, Iowa, Michigan, Nevada, New Hampshire, New Mexico, North Carolina, Ohio, Pennsylvania, Virginia, and Wisconsin.
The Raw Statistics
For those of you who couldn't care less about my writing or fancy graphics, you can break my heart by viewing the raw data and all sources here. You can also see the math of factoring in populations to get overall statistics, if you're interested in that kind of thing.
Also all these statistics already existed somewhere on the internet. They just weren't compiled and presented like this, so I had to do it myself. So much math. *shudder*
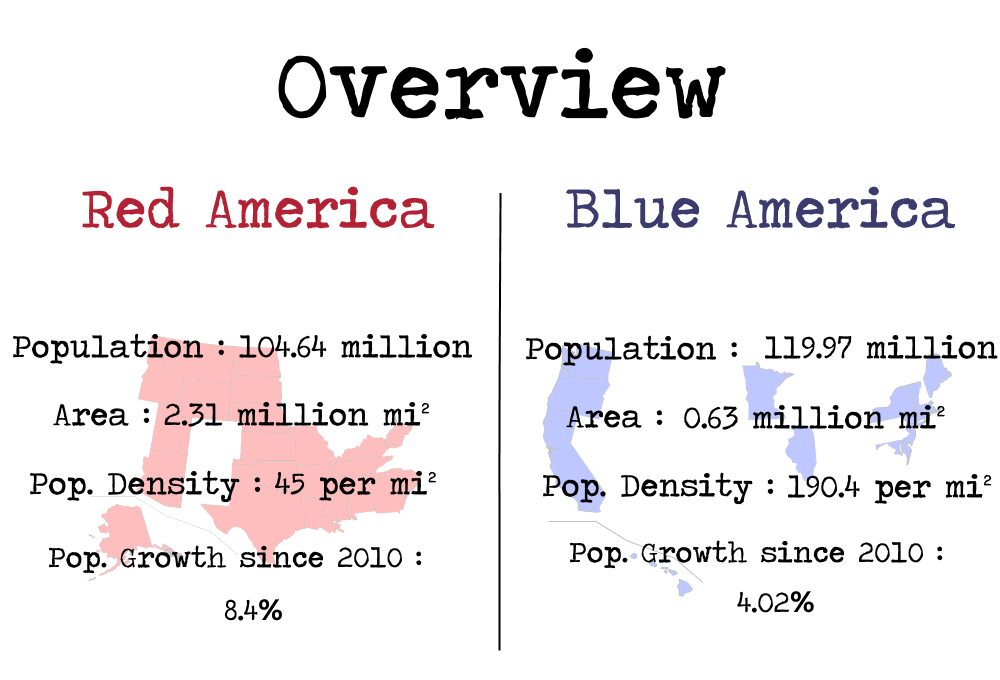
The United States of Red America consists of approximately 104,640,629 people living in an area of 2,312,971 square miles of land. This is a mostly rural country with an average of about 45 people per square mile, just under the population density of New Zealand. The largest city in The United States of Red America is Houston, Texas, at an estimated population of 2,325,502 people.
The United States of Blue America consists of a land based archipelago of highly urban environments, with a population of 119.97 million crammed together at 190.4 people per square mile. Blue America's largest city is, of course, New York City at an estimated population of 8,398,748.
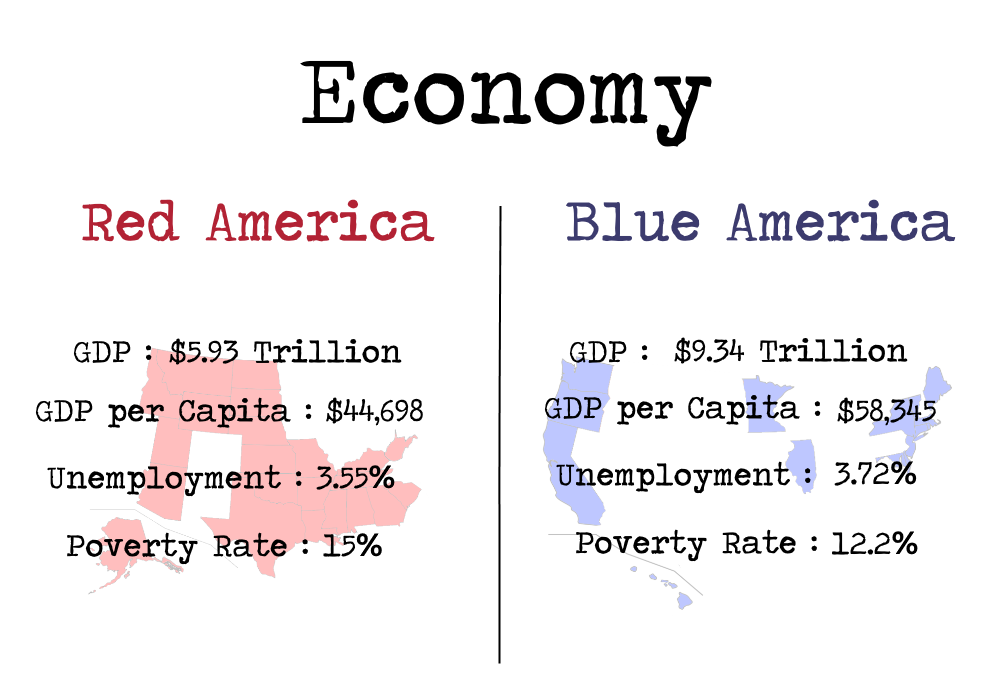
With the vast economic engines of New York and California powering Blue America, citizens of Blue America make, on average, about $13k more than an average Red American. While Red America has a slightly lower unemployment rate, it also has a higher poverty rate, which might seem counter-intuitive to some but it turns out the strength of an economy goes beyond just one indicator.
But while Blue Americans tend to make much more money than Red Americans, it can be easily offset by...
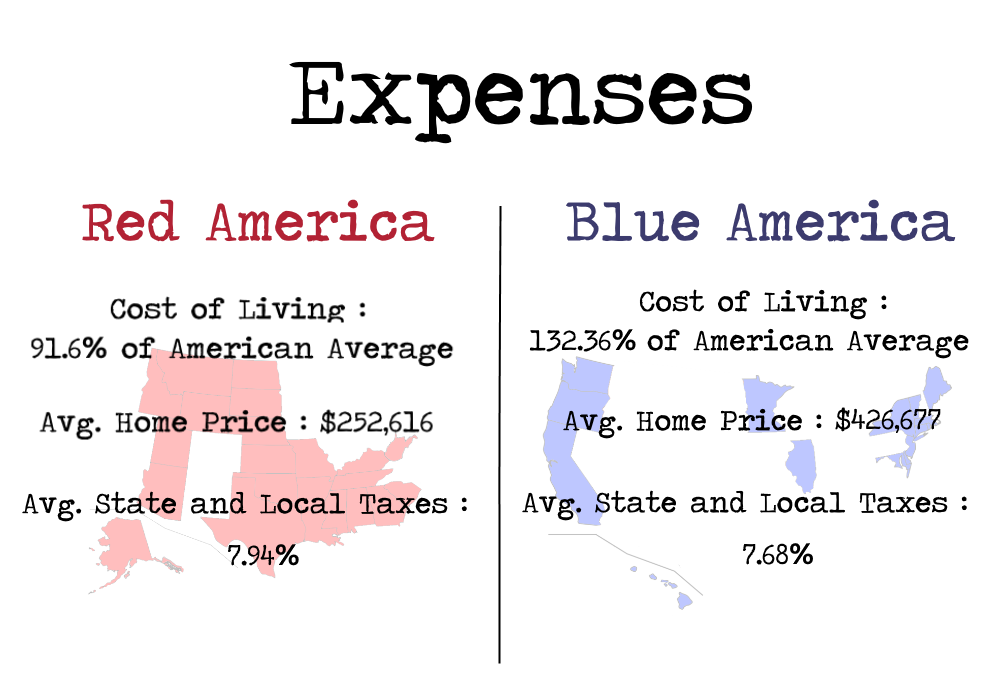
Blue America is very, very expensive. It's important to note that California and New York comprise nearly 50% of the entire population of Blue America, but still, $426k for an average house? That's insane! For that kind of money, I could get a very nice house in Red America, but not on the coast. Red America has very little coast to go around.
This also contributes to the fact that it costs 35.2% more to live in Blue America than in regular America, as opposed to being 8.4% cheaper to live in Red America.
But now I need to talk about a fact that I had to check, and double check, then check again because it just didn't seem to add up. Red America has higher taxes than Blue America? Was that just the sound of a thousand browser tabs closing? I think it was, but from what I found, it's completely true.
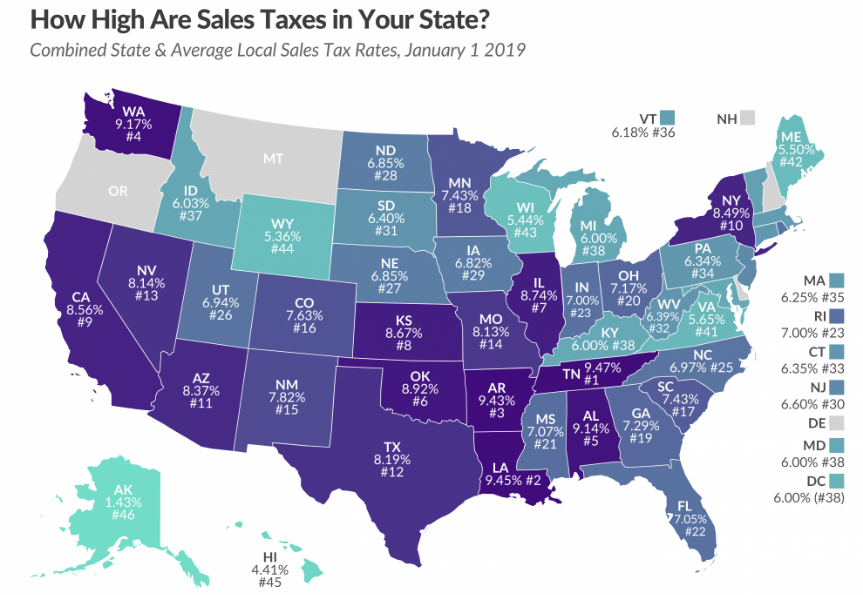
Well if you can't trust fancy graphics, what can you trust? Now someone please double check this for me so my reality can unshatter.
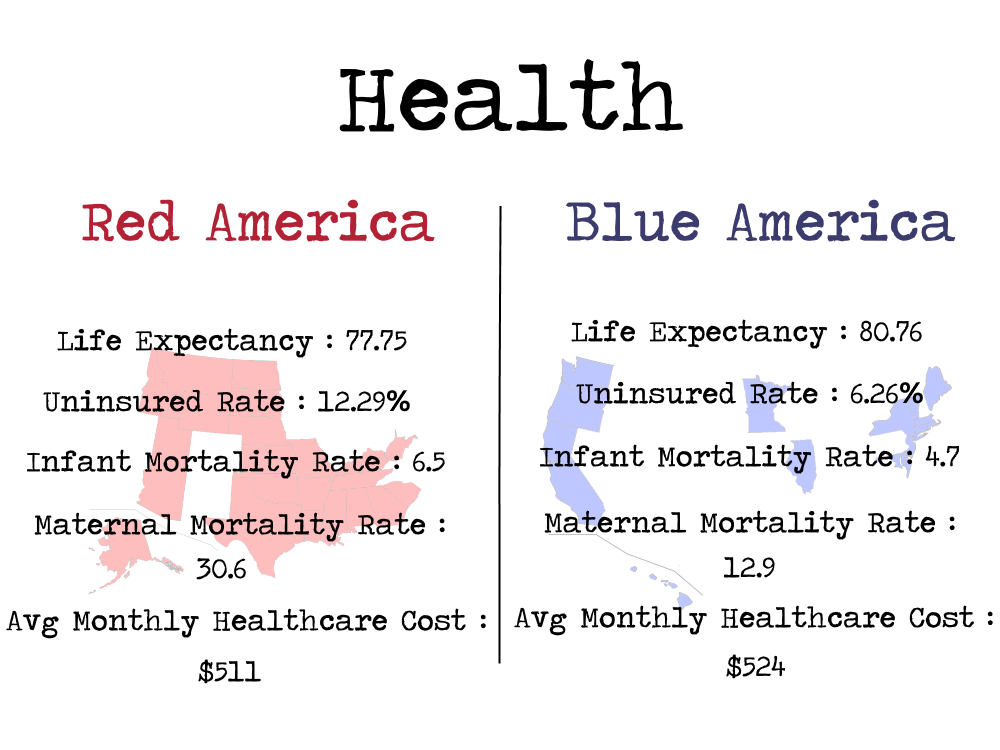
So here we see some of the largest difference between Red America and Blue America. First off, a 3 year difference in life expectancy is not a small thing. Those three years are the difference between Denmark (80.8 years, 28th globally) and Uruguay (77.8 years, 41st globally). Sure, maybe you don't want to live your 78th year on Earth, but a lot of people do, and you have a much better chance of doing that in Blue America, and a large reason for that is health insurance.
Red America has about double the uninsured percentage as Blue America, leading to higher infant mortality rates and much higher maternal mortality rates, which occur up to, and a year after, pregnancy. Red America's Maternal Mortality Rate put it in the same league as Sri Lanka and Romania (71st and 73rd globally) while Blue America is more akin to Qatar (45th globally), neither of which are generally great places to be. And speaking of death!
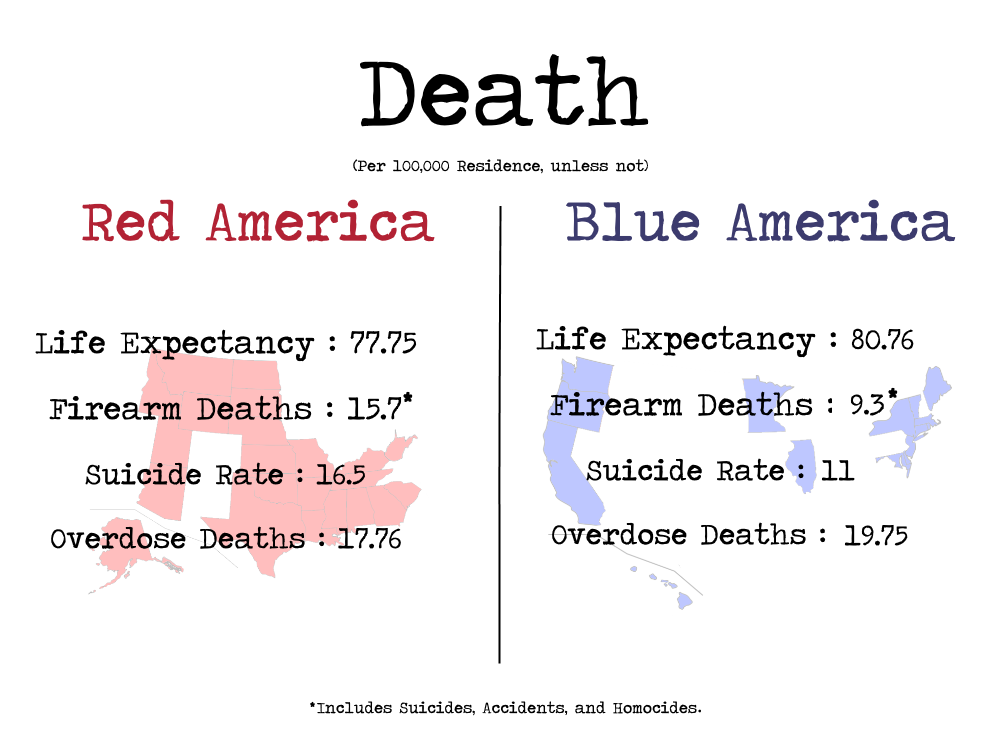
I included life expectancy again because it's pretty pertinent to both health and death. Kinda the in-between part. But yeah, turns out you're much more likely to get shot in Red America, either by yourself or someone else. It's probably due to Red America having so many more guns than Blue America (and yes, I know that statement will offend some).
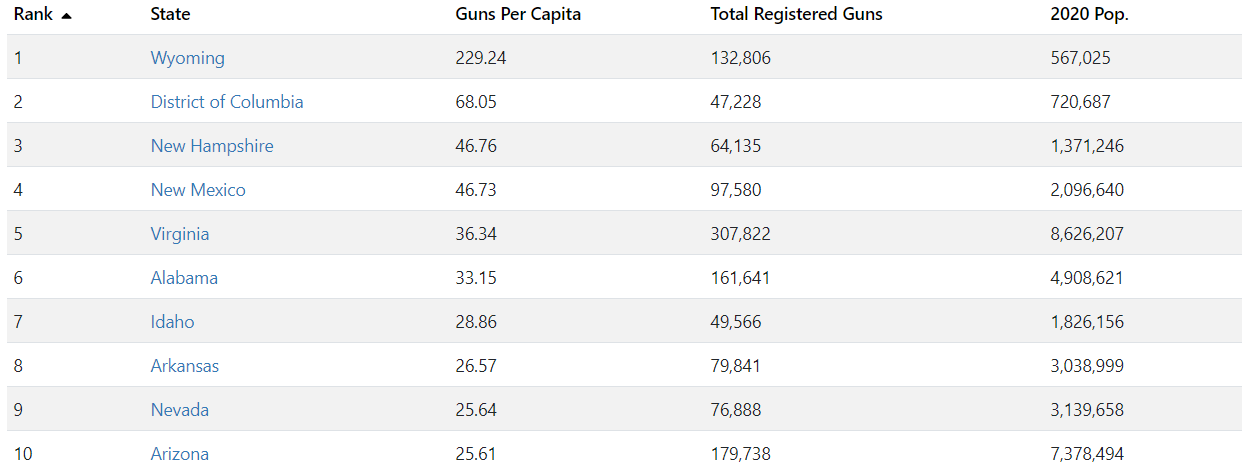
Makes you wonder if Wyoming knows something we don't.
Red America also has a substantial lead on suicides over Blue America, which certainly isn't a competition. I can't really comment any further than the number because I'm not that qualified to talk about, well anything, really. But while suicides and firearm deaths take the lives of Red Americans, Blue Americans were hit especially hard by the opioid epidemic, which claims too many lives from both countries. Whew, that was heavy. How's about something a bit lighter?
Ugh! This isn't lighter. This isn't lighter at all.
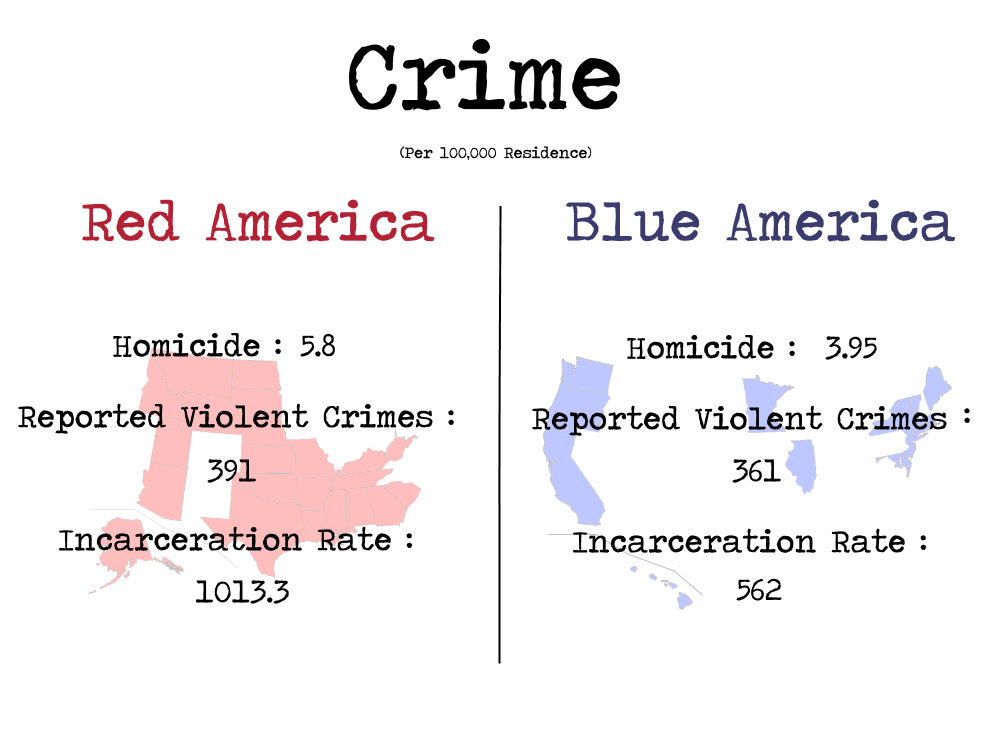
Even with those big bad Blue American cities that Snake Plissken is always shooting his way out of, statistically you are much more likely to get murdered in Red America than Blue America. About as likely as getting murdered in Ecuador (5.8 per 100,000, 84th globally) as opposed to Blue America's Lebanon (3.99 per 100,000, 107th globally)
But the standout statistic here, and perhaps the entire data-set, has got to be Red America's Incarceration Rate, where more than 1% of their total adult population is behind bars. That easily ranks Red America as the most incarcerated country on the planet. Maybe that's why they have to pay higher taxes. Those inmates aren't going to feed themselves.
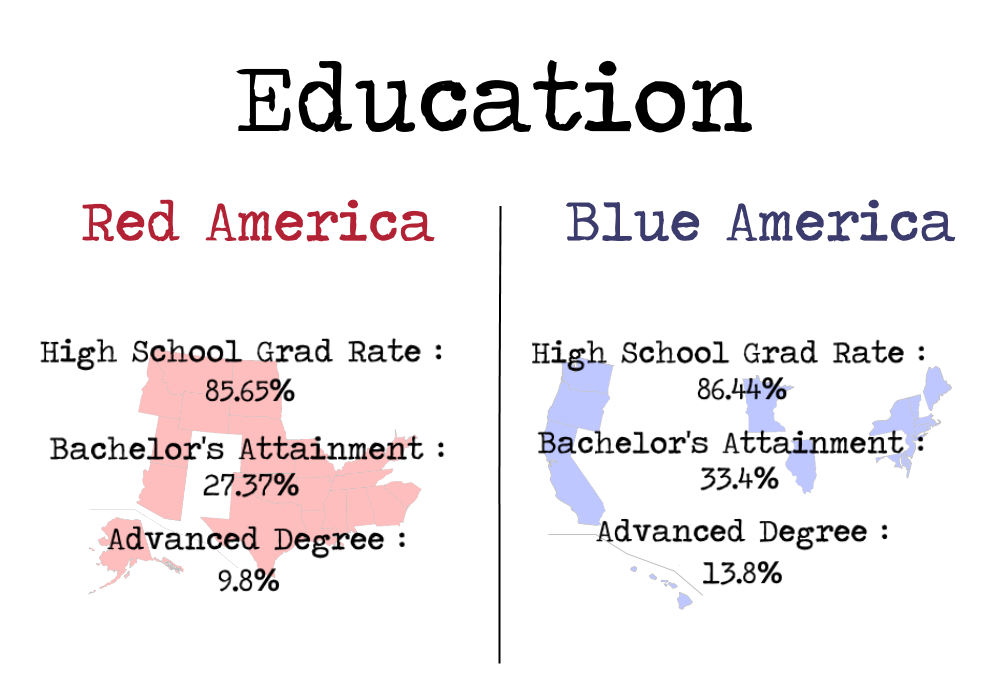
Whew, that's a bit lighter. It will come to little surprise that Blue America is generally better educated than Red America, but not by leaps and bounds. Both countries rank nearly the same in terms of high school graduation rates, but the further up the education totem poll you climb, the more the two countries diverge.
Even with the myth of the Blue State ivory towers, however, there is still only a 4% difference between advanced degrees. I think it's possible stereotypes may be a bit overblown.
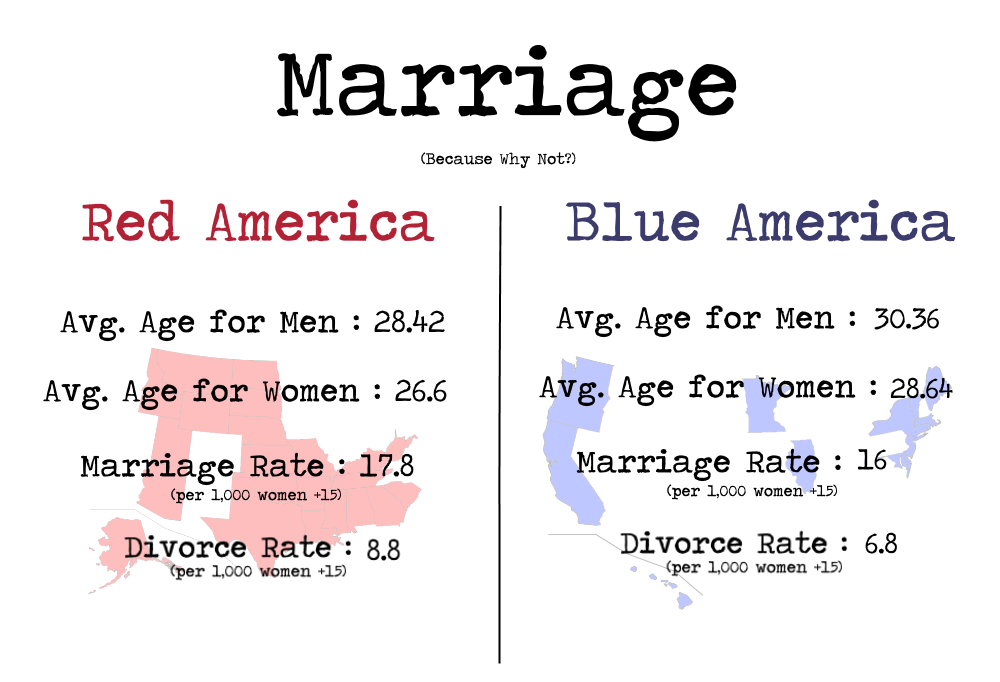
Why not finish it up with marriage? I suppose if we were going in chronological order, death should be finishing this up, but hey, let's end on a high note. It will come to no surprise that people are generally more excited about marriage in Red States, getting hitched about 2 years earlier than Blue States, having a higher chance of getting married, and an even higher possibility of divorce. So if you're excited about marriage, and even more excited about divorce, Red America is the country for you.
So what does all this mean?
Wow, asking the big questions are we? Well I have no idea. I'm just the guy with the numbers. Why are you more likely to get murdered, married, divorced, and put in jail in Red America? Shrug. There are really too many factors to take into account to pin it on any one thing. Maybe the Southern United States has been eternally held back both economically and educationally by the Civil War and hookworm? Maybe the early concentration of industry and finance in the Northeast created an imbalance still felt to this day? Maybe Democratic policies are better at facilitating safe and prosperous constituencies than Republican policies? Who knows! I'm just a guy with a Google spreadsheet and a week off work.
Thanks for reading.

2 Comments Add a Comment?
Gwen
Posted on Feb. 21, 2020, 8:33 p.m.
Excellent article, Rory. Now if you overlay those stats on the electoral college and the Senate, you see how the US got where it is. In fact, it would be instructive to do another graph comparing state population in red and blue America with Senate seats and voting patterns. If you’re up for more statistics, that is.
Clay
Posted on Feb. 22, 2020, 10:42 p.m.
Your tone got more snarky as you went on. If you could keep it strictly non-partisan you’d REALLY have something.
Texas has no state income tax. States also use property tax. Did your numbers on look at Sales Tax? I also found that number to stand out as surprising. ????